Profiler Log Database
To view Profiler Log information
- Open the Profiler log database.
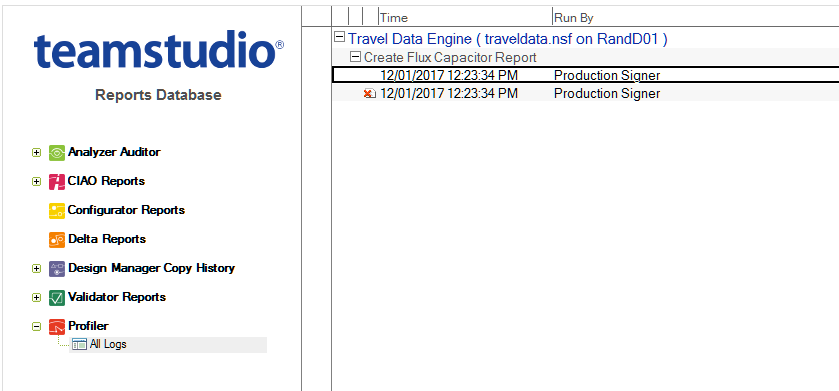
The red icon in the Time column indicates that Profiler encountered an error that prevented it from running on the selected code. - Open a document to view more details.
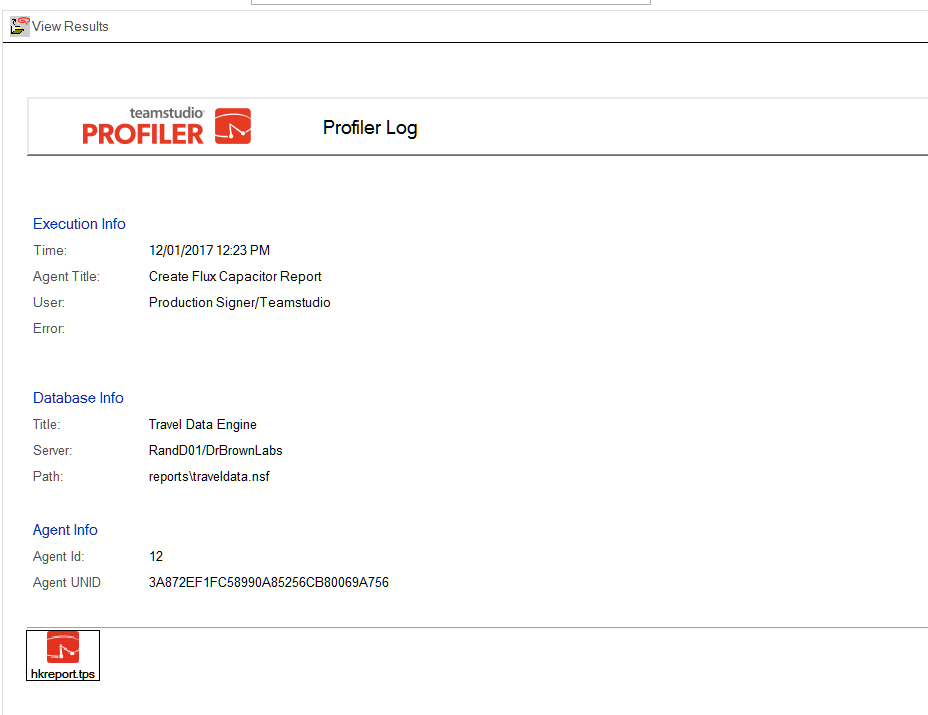
- Click the View Results button at the top of the form. This launches Profiler to view the attached results.
You can also save the attachment to your hard drive, launch Profiler from your Notes client and click **File > Open** to open the file.Note
Profiler Client must be installed.